Auckland City Council provides a mountain of data through the use of their GIS map website. This is a site where anyone can go to find information on the land and its surrounding context. This becomes particularly useful for the likes of architects, designers and urban planners, who need detailed information about the sites they work with.
In regards to our 9 Mount Street site location it is necessary for us to do detailed research on the surrounding context of the site to better inform our design decisions. I decided to focus on the following; Aerial photography (1950-2017) Underlying features, Hydrology, Land cover and Tangata Whenua.
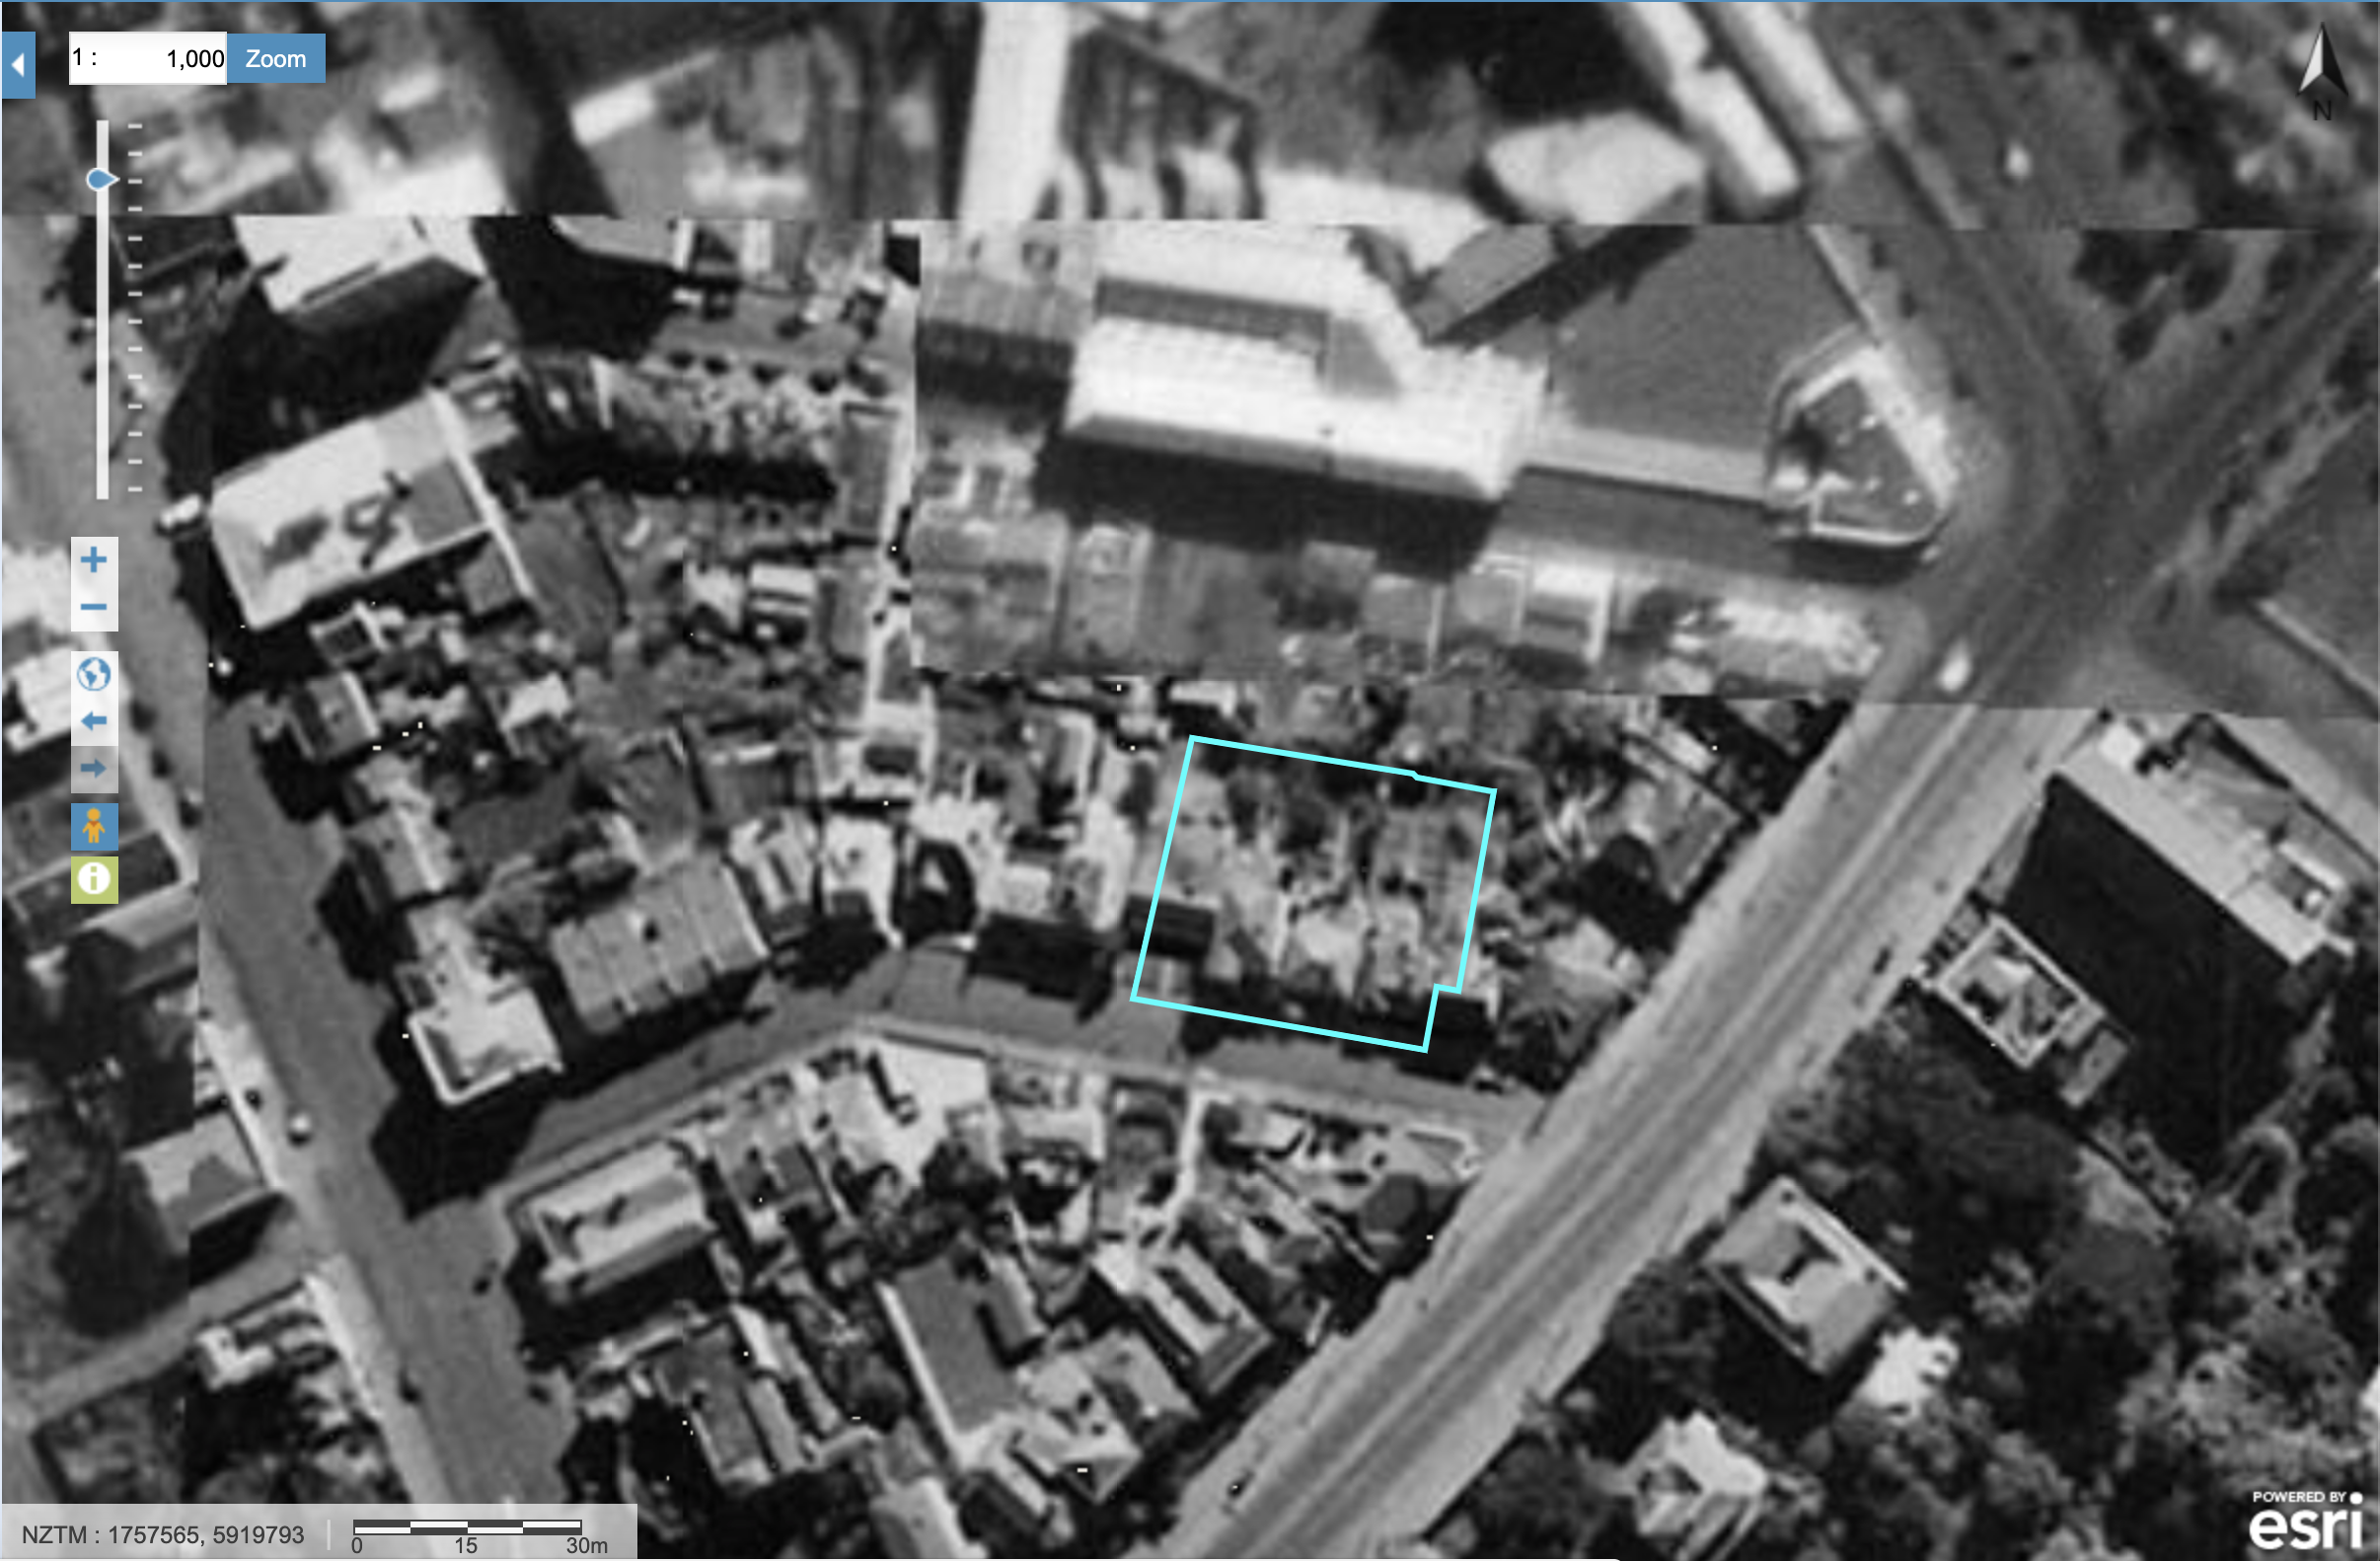
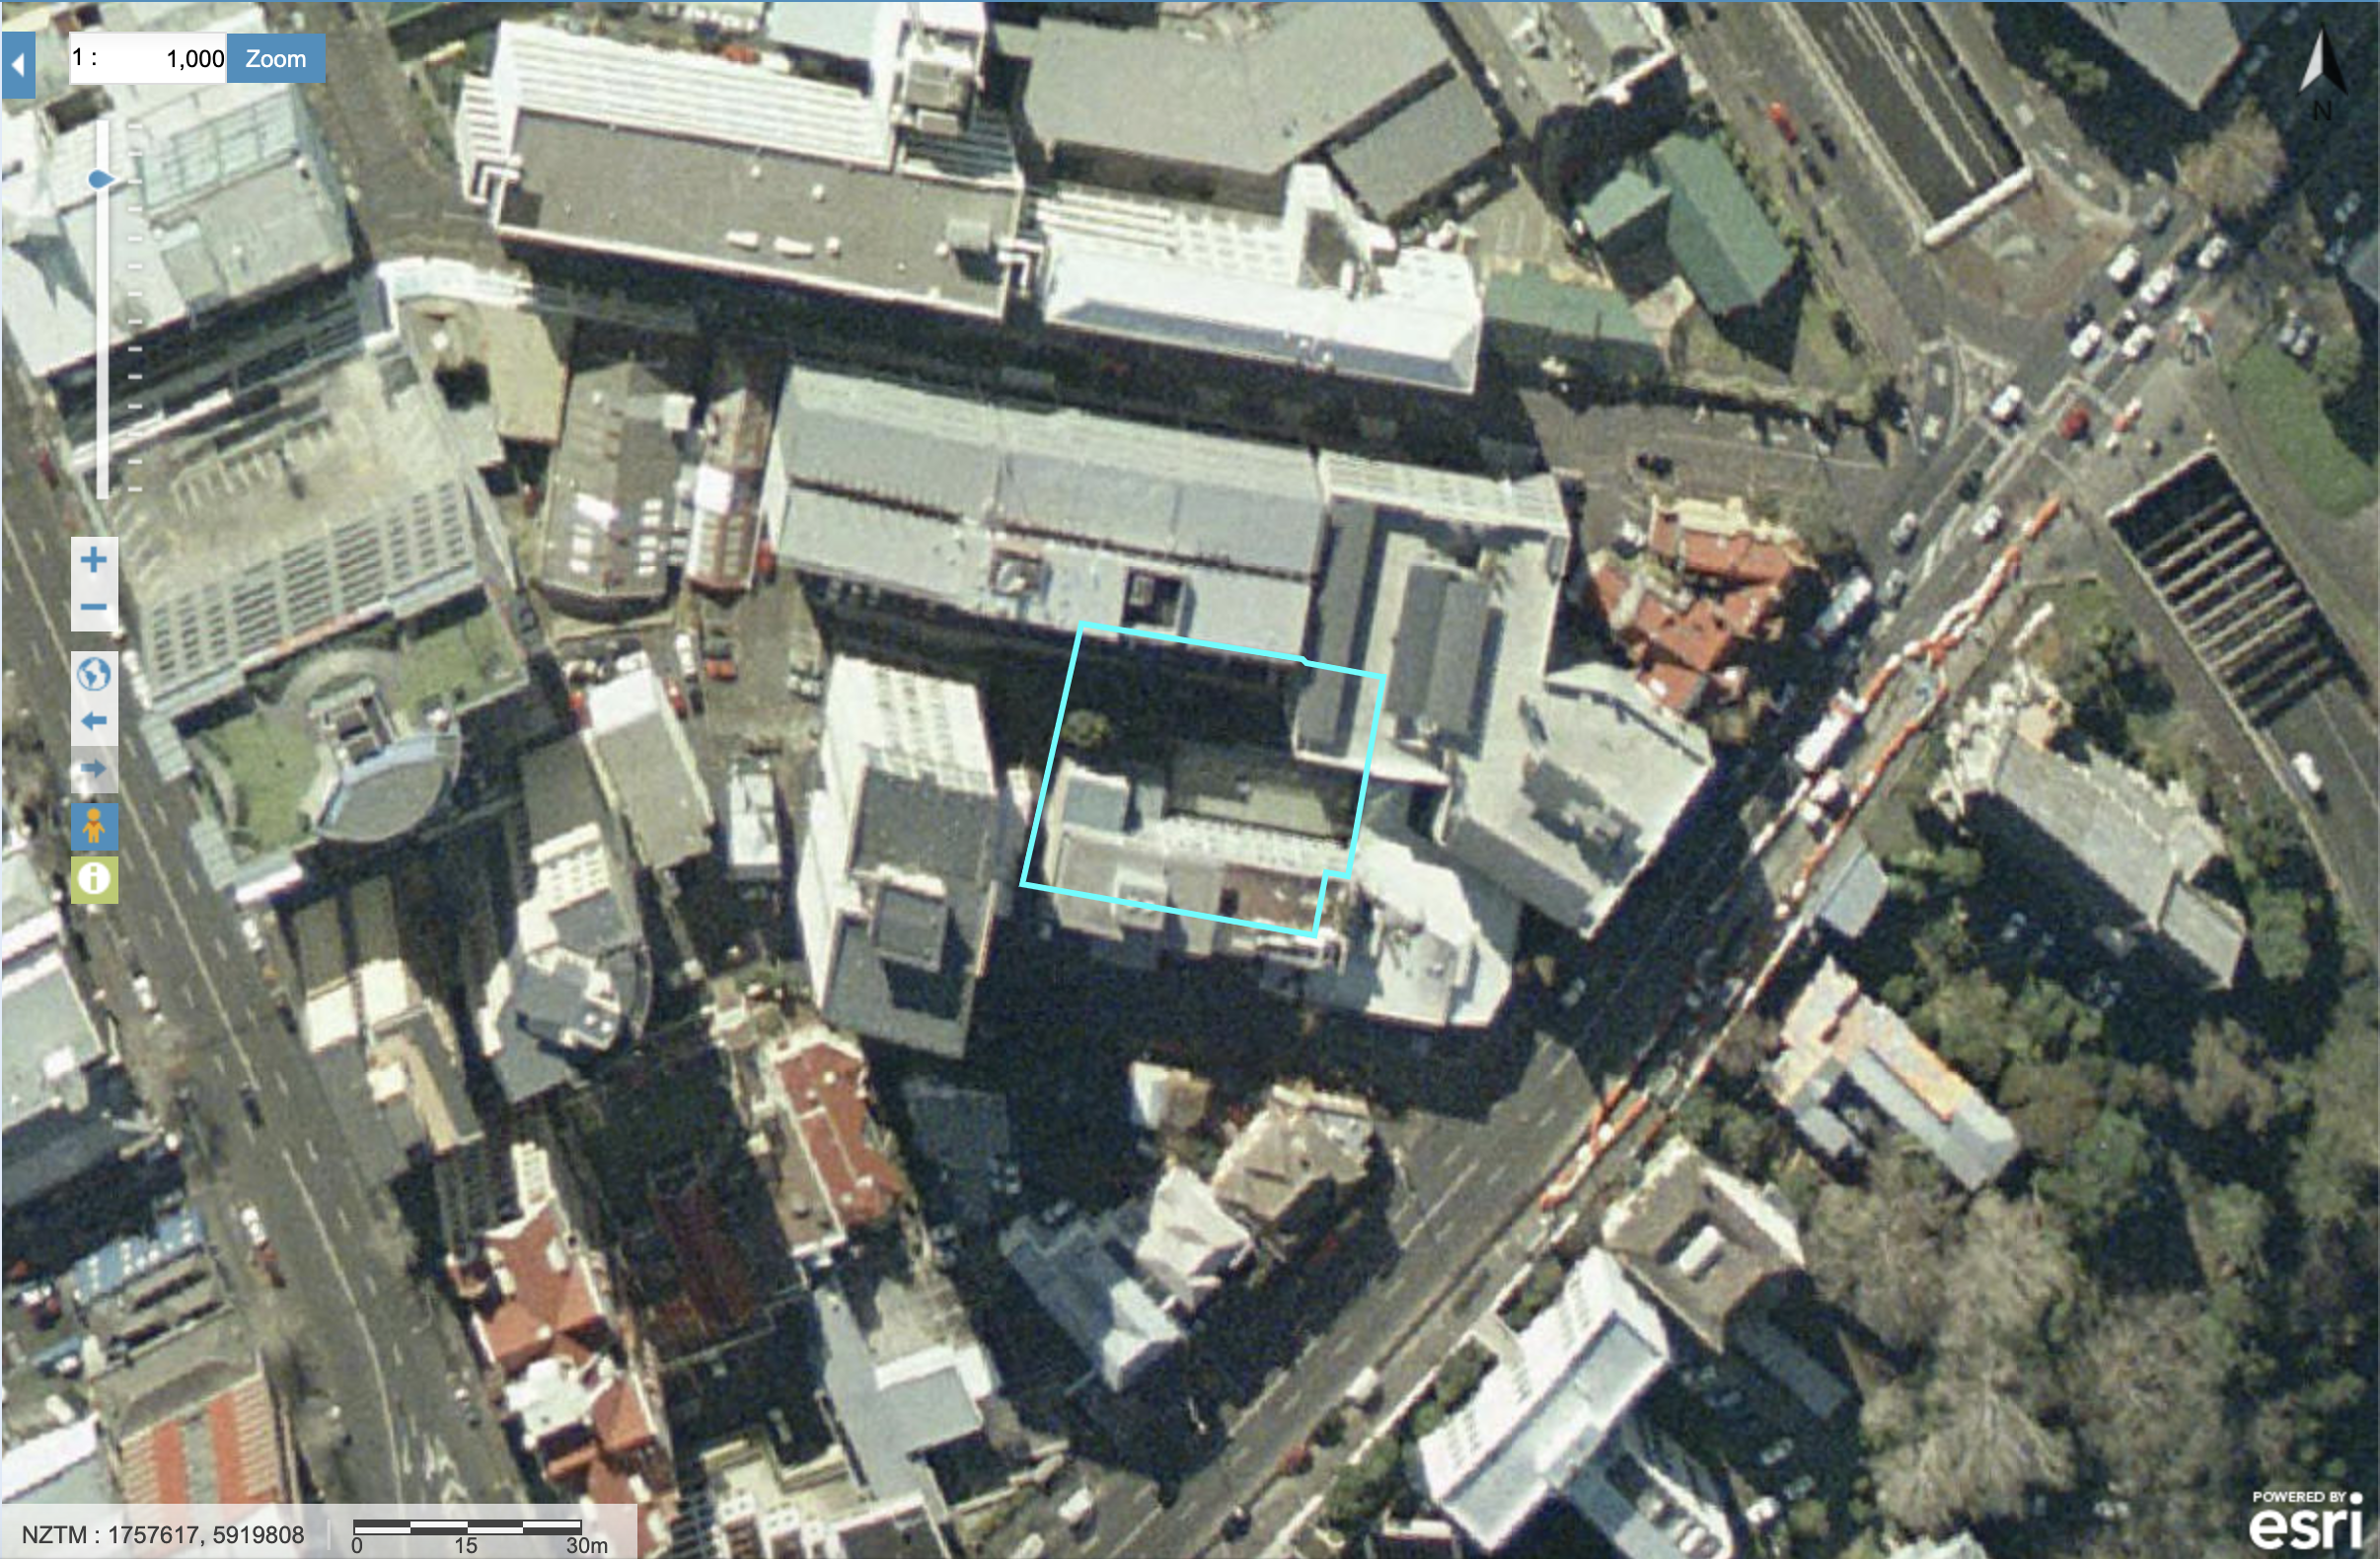
Aerial Photography
This collection of aerial photography below provide us with the knowledge of both the past uses of the site and the rate at which this area developed. This will help to gain context on the history of the area and the surrounding environment.


Underlying Features – Hydrology
GIS also allows you to see all of the underlying features of a site. In this screenshot below I have studied the Hydrology of the site and it’s wider context.
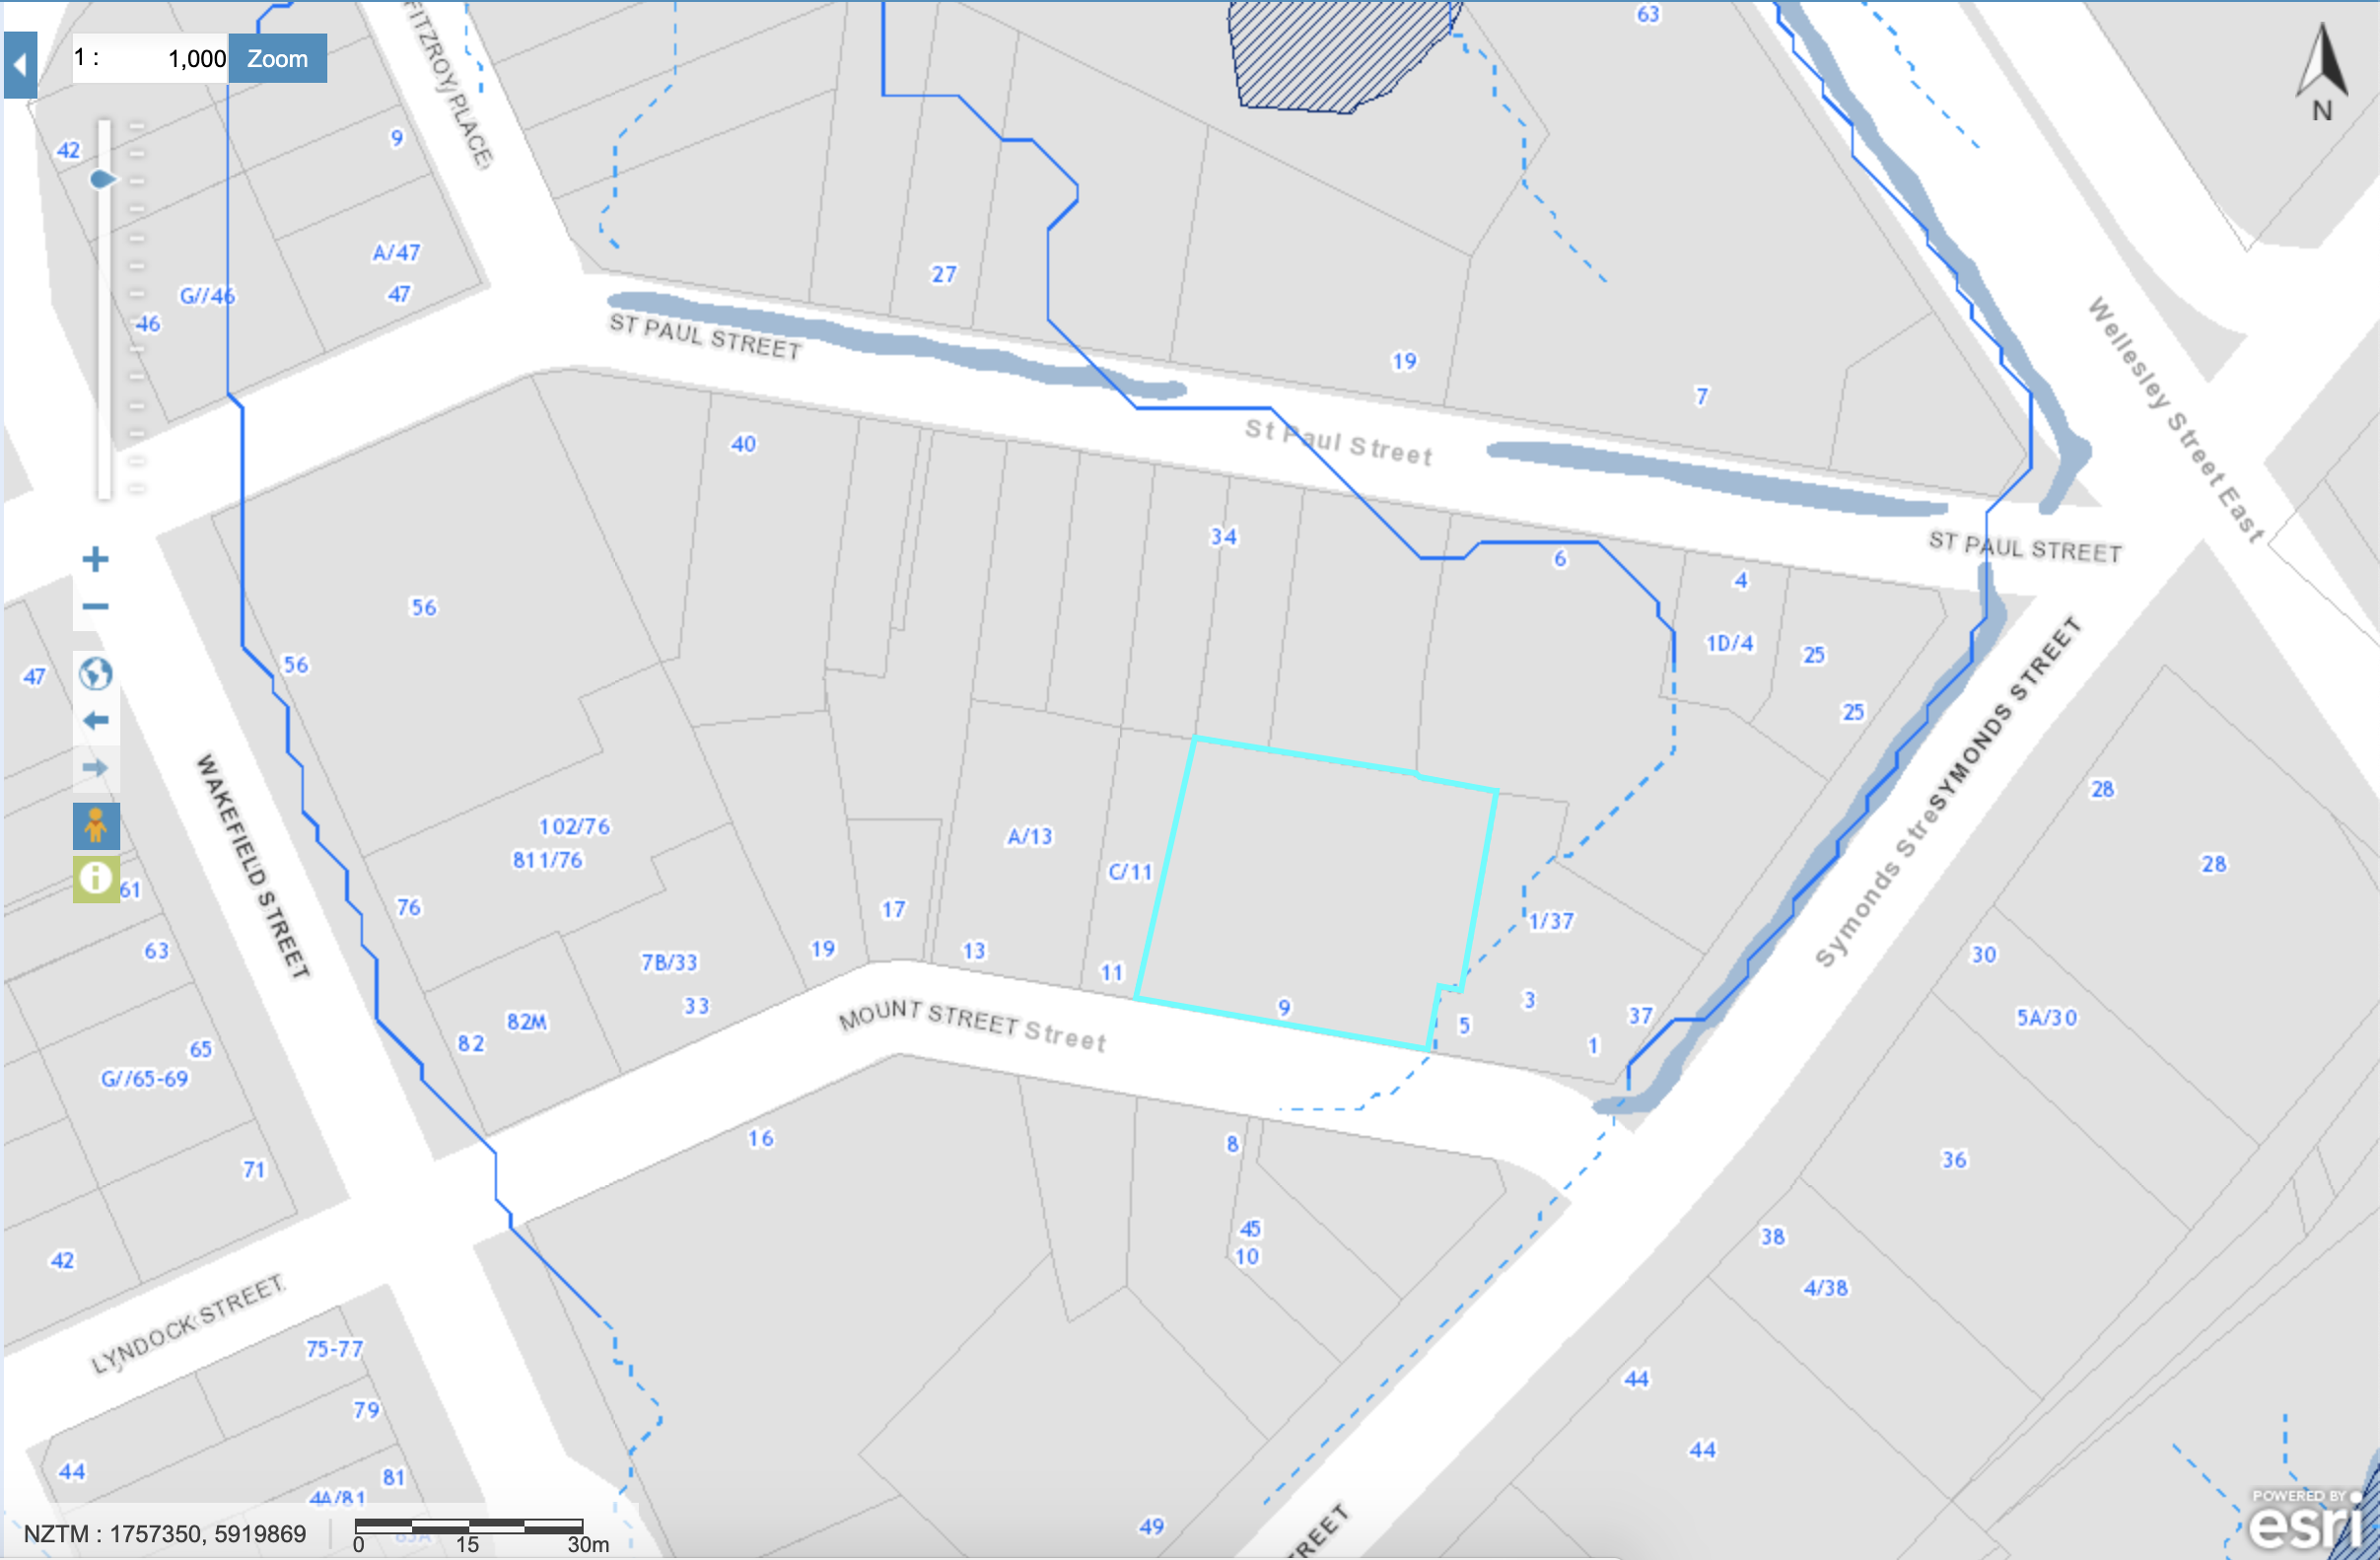
There are a couple of different things being shown here. The dark blue lines represent overland flow paths and the light blue patches seen along St Paul Street and Symonds Street represent flood plains.
From examining this overlay there seems to be some sort of water flow just on the boarder of our site outline. This is . represented b y the light blue dotted line. Referring back to the GIS key, it states that this light blue dotted line represents (overland flow paths of 2000m2 to 4000m2) This is the lowest volume of water flow shown on the map, meaning that it is most likely not a big problem but still something to be considered.
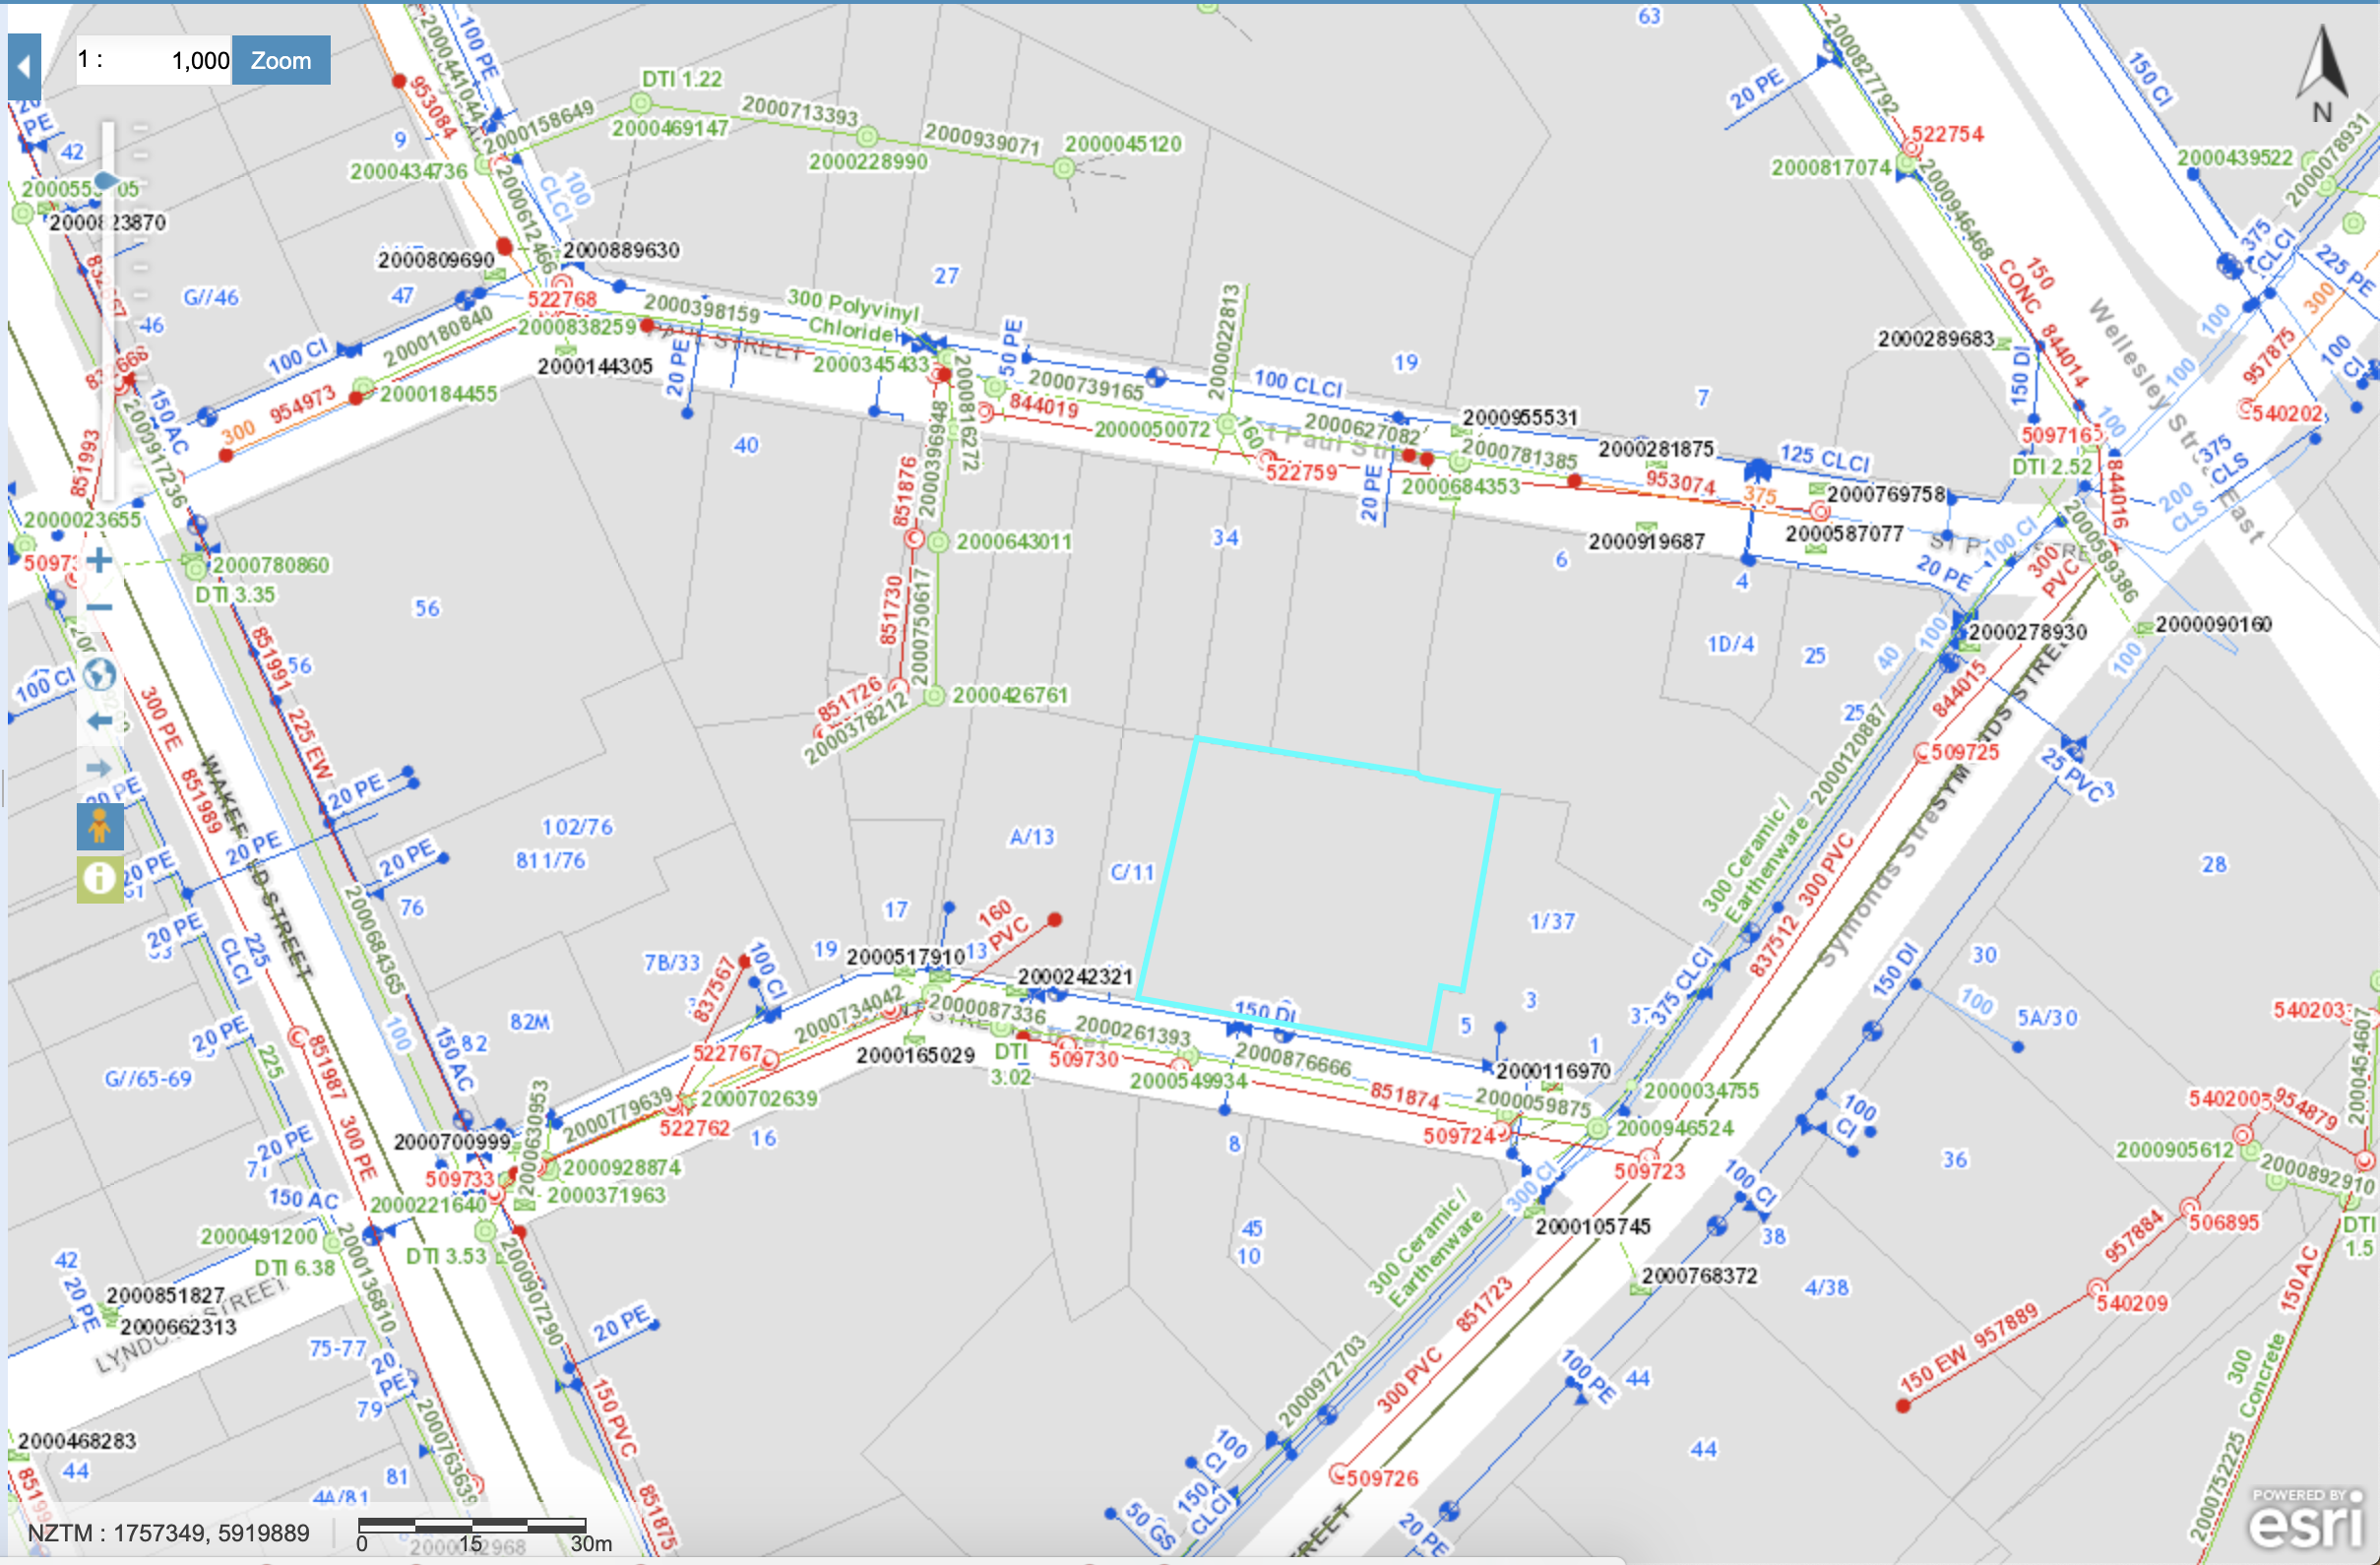
This GIS overlay allows us to see all the underlying pipelines of the site and surrounding context.
- Wastewater pipes are shown in RED
- Stormwater pipes in Green
- Standard water in Blue
Upon further inspection, there doesn’t seem to be any underlying waste water pipes within the sites boundaries. I am assuming that this would be a problem and that an existing waste water pipe would need to be extended in order to meet the bathhouse waste requirements.
Land Cover
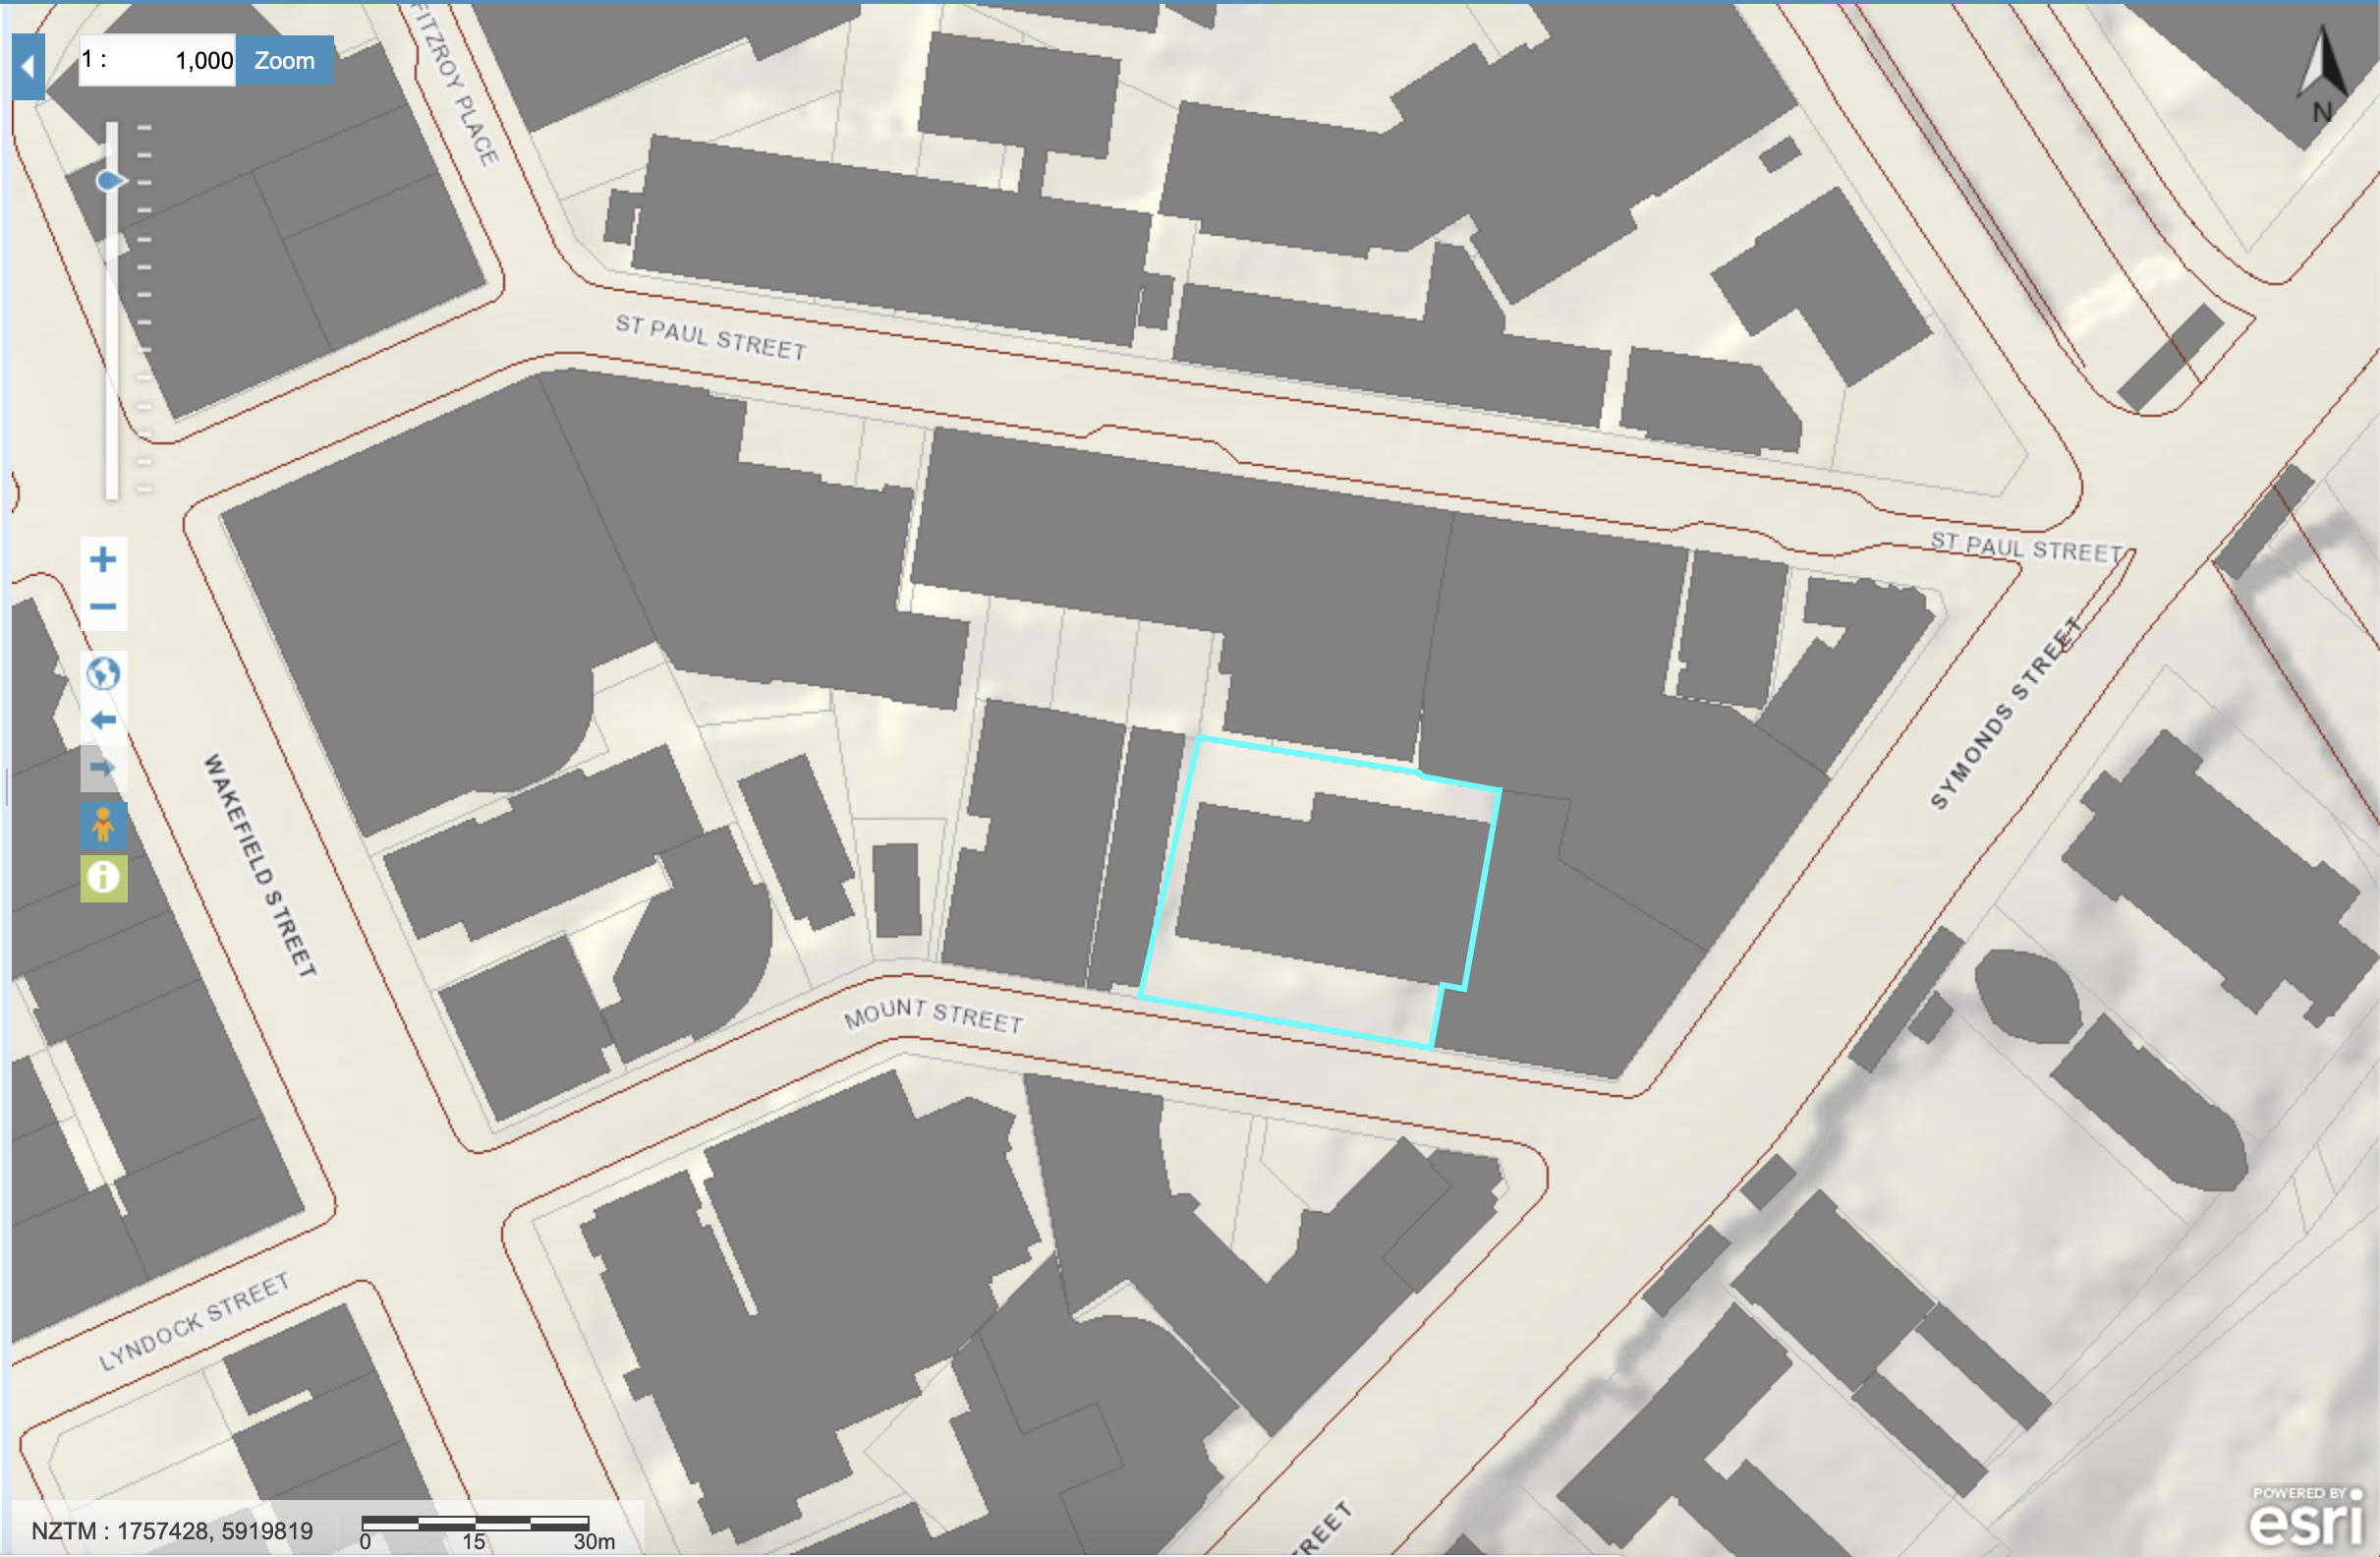
This GIS map overlay allows us to see the current land coverage of the site and surrounding environment. The grey represents current building outlines. This image emphasises how compact the site is, with surrounding buildings right up on the boundary lines. This also helps me to realise the importance of light in regards to my design as natural light is limited.
Tangata Whenua
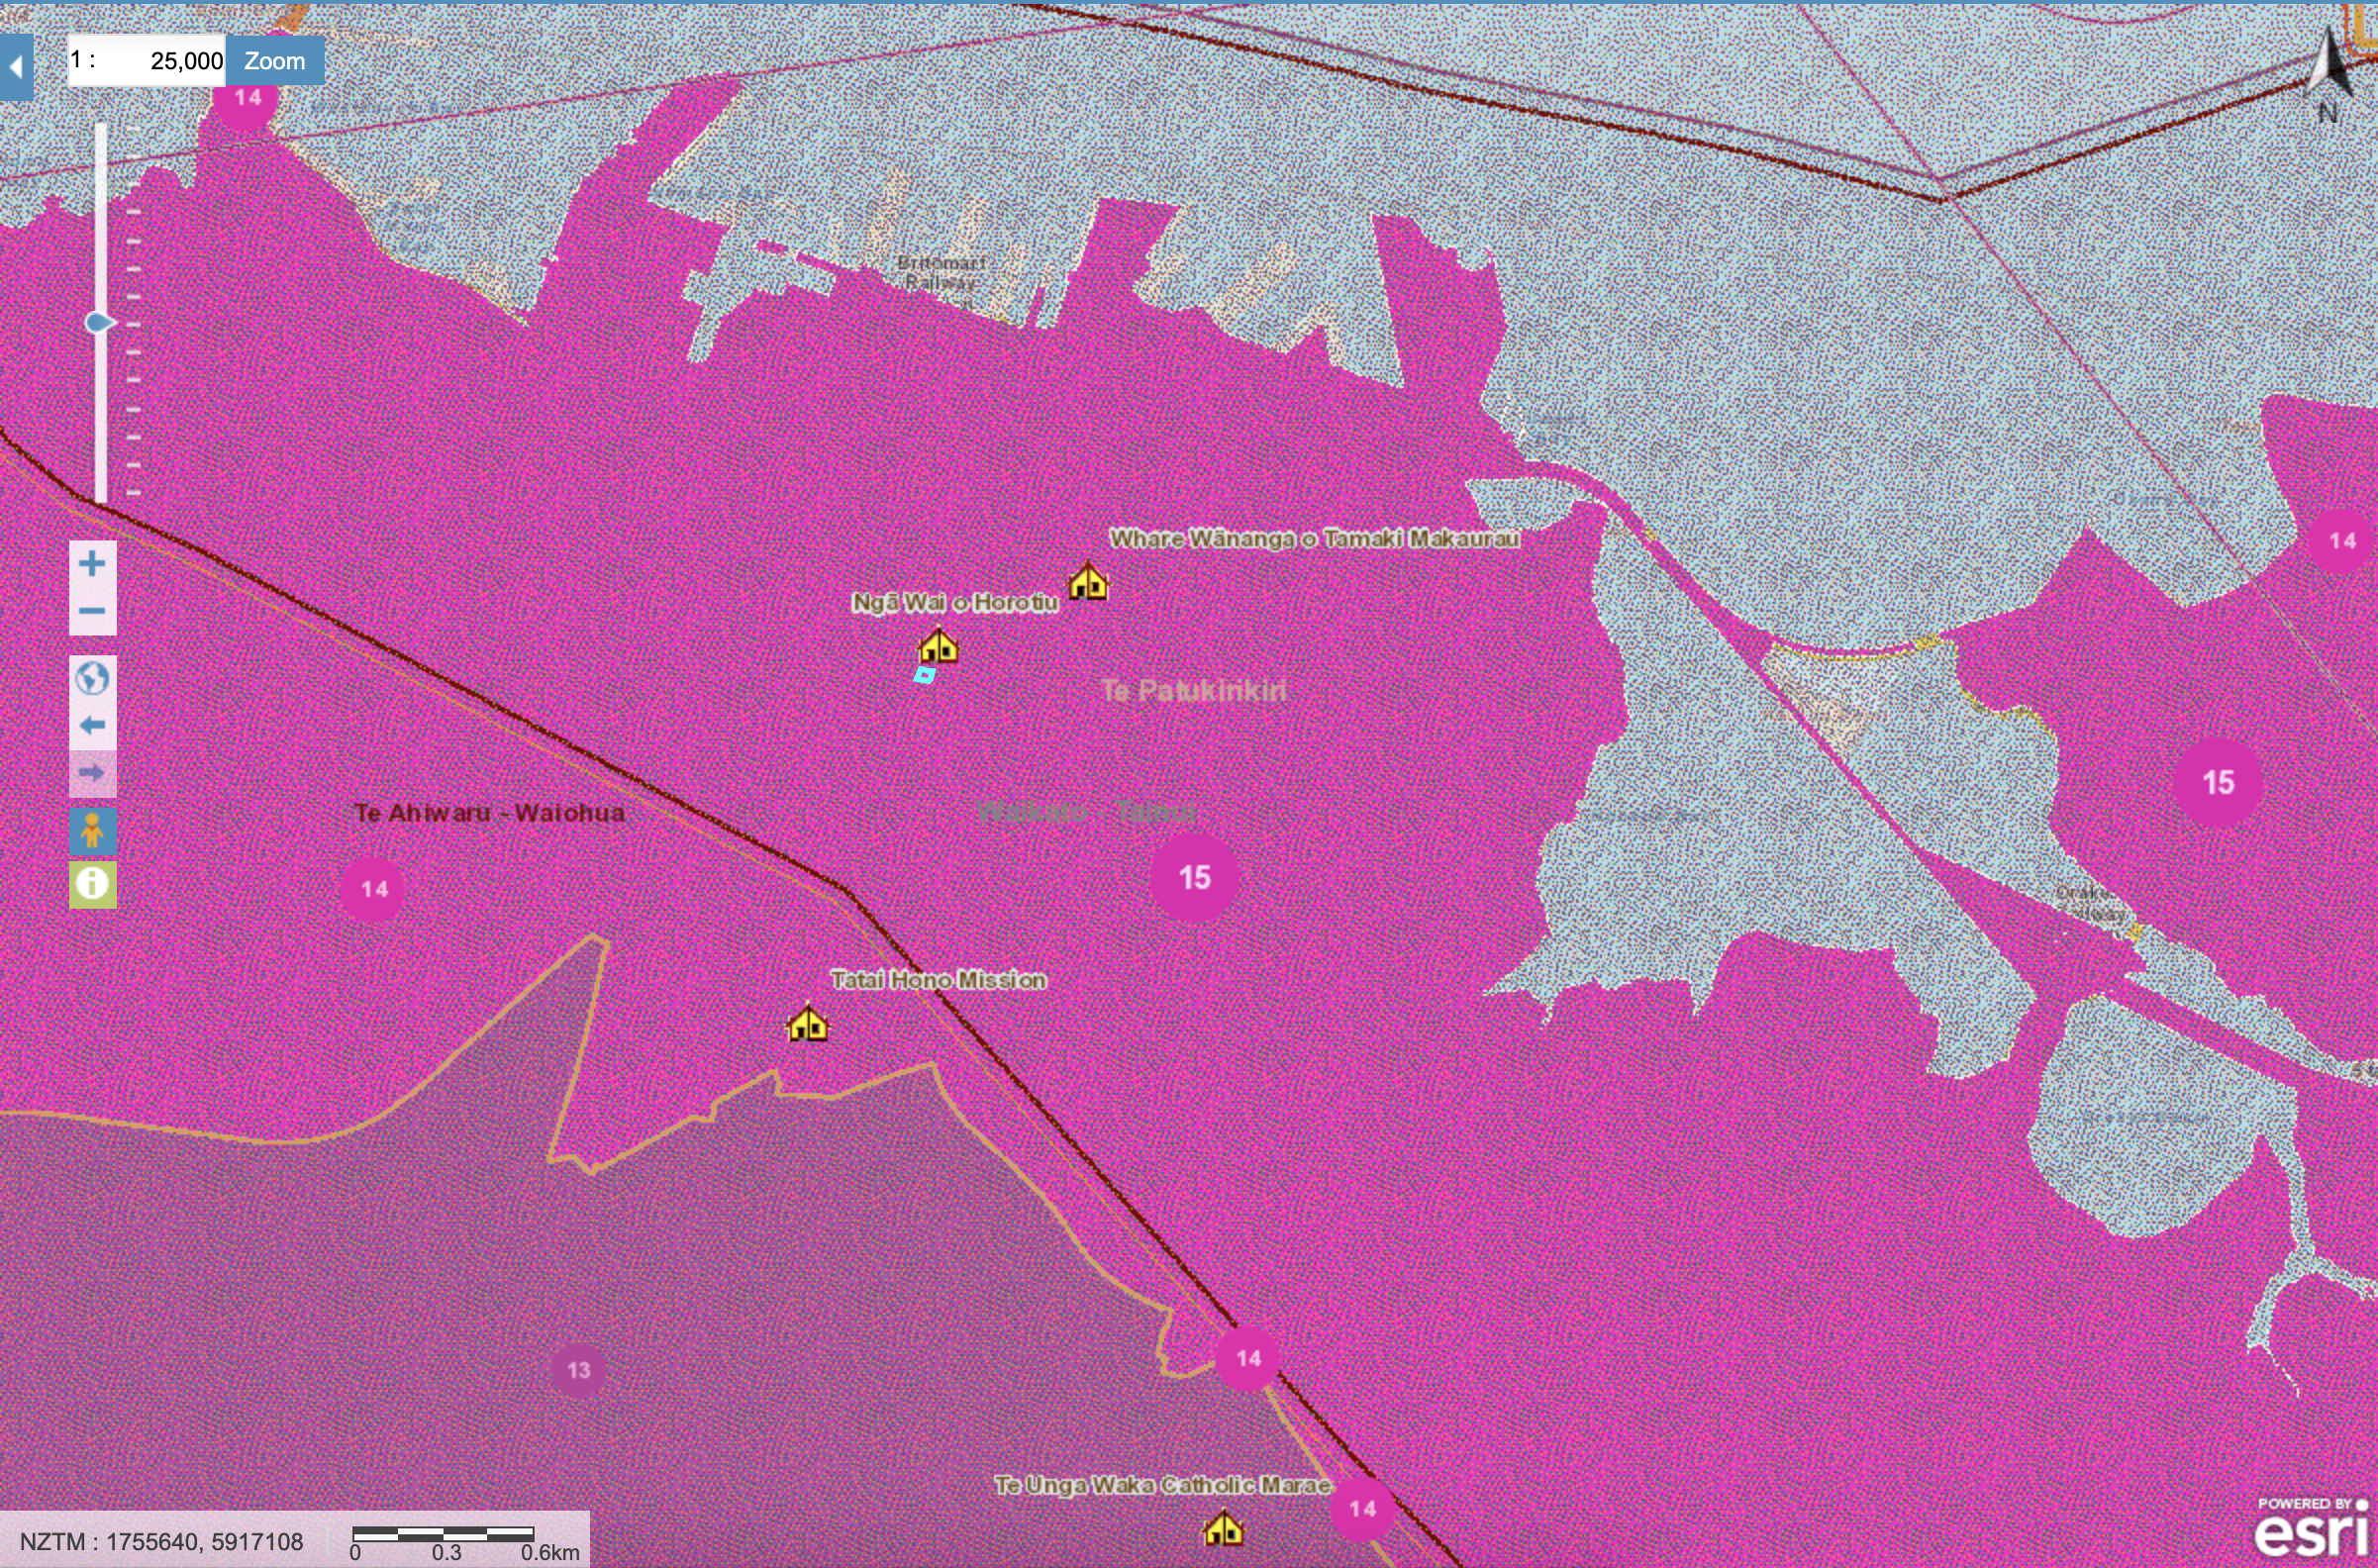
This GIS map overlay outlines the Mana Whenua areas of interest. It allows one to see what Iwi’s are associated, affiliated and connected to the site and its greater environment. In many cases there is more than one Iwi associated to a particular area with many overlaps.
In regards to our site, the associated Iwi is Te Patukirkiri
There are also two Maraes in the vicinity, AUT’s Ngā Wai o Horotui and UOA’s Whare Wānanga o Tamaki Makaurau
This is important information especially when is comes to taking into consideration the Te Aranga Design Principles. It would be necessary to contact the local Iwi in regards to what cultural aspects of the site and environment should be protected and uplifted. It is the Iwi’s best interest to conserve and add to their spatial environments through the use of good design. This is especially prevalent in design of public spaces.
